View Results
This page walks through where to find pipeline runs in the dashboard and what each part of a run’s page shows. See How It Works for the underlying model.
The screenshots come from one real run of a small pipeline: a build step compiles and tests a Go program, then streams the binary to a smoke-test step that runs it.
Find a Run
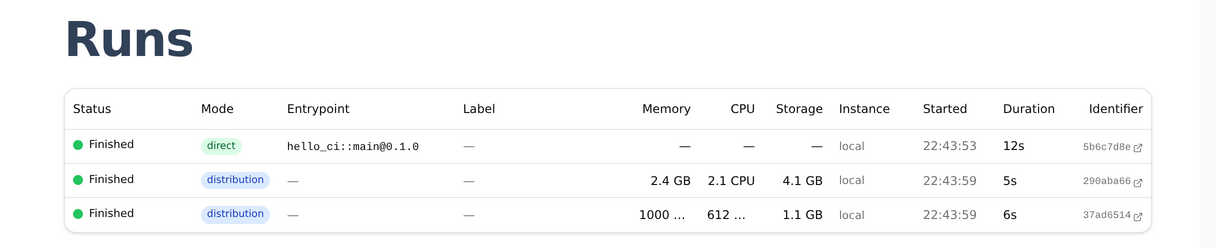
- Open Runs, under Execution in the dashboard. It lists every run of the organization, most recent first, with its status, mode, entrypoint, resources, instance, start time and duration. The
directrun is the one you launched; eachdistributionrun is a step the pipeline dispatched to a machine of its own.
-
Click a run to see a summary, or open it to reach its page.
-
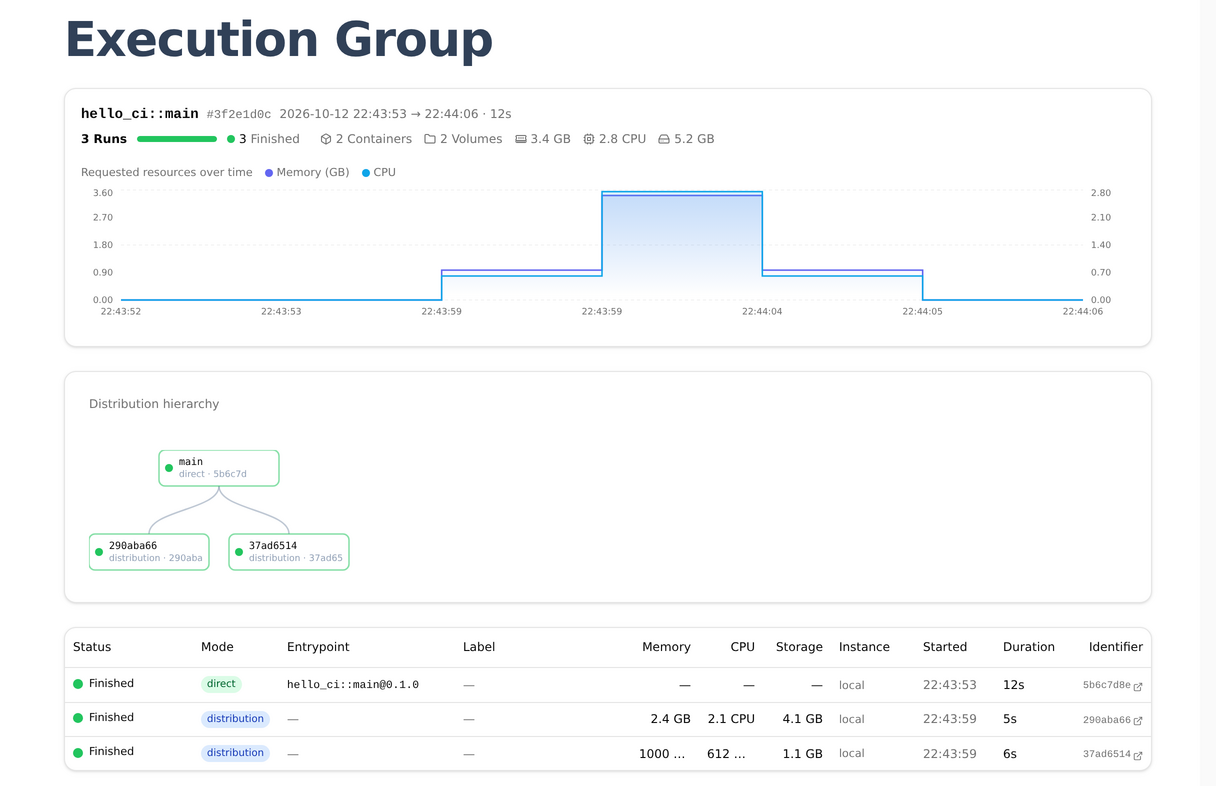
Open Groups, also under Execution, to see the runs of one execution together: the direct run and every distribution run it started. A group’s page charts the resources requested over time, draws the distribution hierarchy, and lists the runs. From a run’s page, Go to Group leads there too.
Read a Run’s Page
Header
The top of the run page shows the run’s status, its mode, the entrypoint that was launched, when it was requested, started and finished, and the tags and parameters it was launched with. A parameter typed Secret appears by its name only.

Pipeline Graph
Below the header, the pipeline is drawn as a graph of treatments and connections, reconstructed from the program that was actually executed. If the run produced debug events, a timeline runs under the graph: each colored mark is a group of events. Click one to zoom in, or move the cursor through the run.
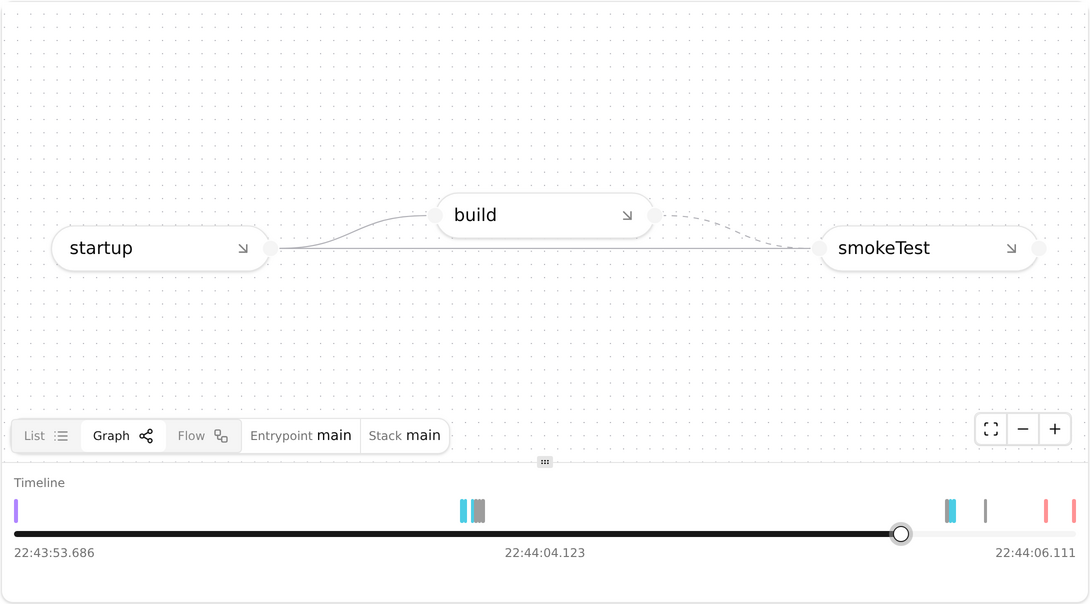
The graph highlights the treatment or connection of the event at the cursor, among the ones it shows. A step is made of inner treatments: open it with the arrow on its node to follow its own events.
Resources
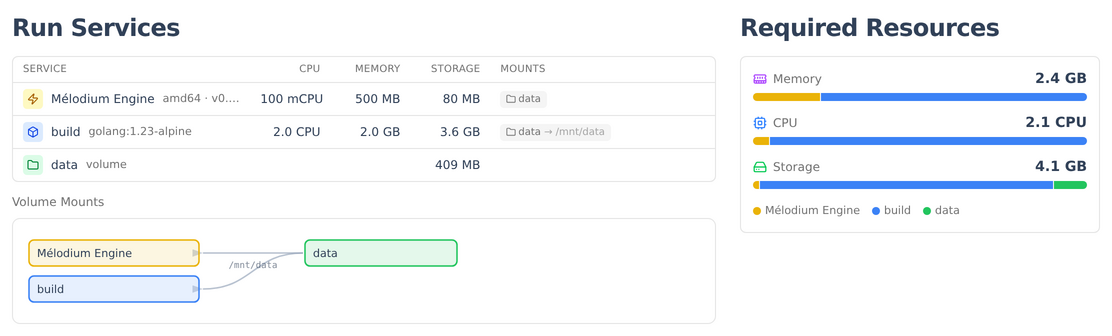
The page of a step’s run lists its parts: the Mélodium engine, the step’s container with its image, and the volume they share, each with the CPU, memory and storage it requested. Required Resources adds them up.
Logs
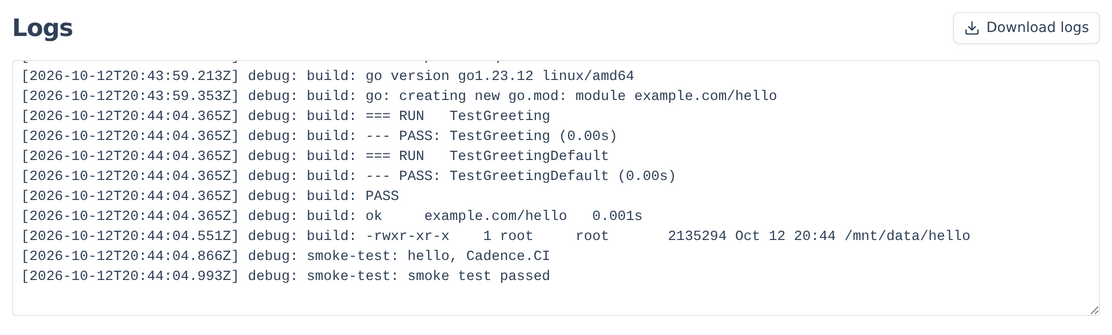
The Logs panel streams the run’s logs in near real time: it polls for new chunks every few seconds while the run is ongoing, and stops once the run has finished. Logs can be downloaded as a single file at any time, including while the run is still in progress.
Debug Data
Below the logs, the Debug Events panel lists the debug events captured during execution, one per line with its time and kind. It’s hidden by default: click Show to open it, and filter by kind, track or any field. The events can be downloaded the same way as logs. Runs reported with --api-report capture them at the basic level by default; see Debug Events.
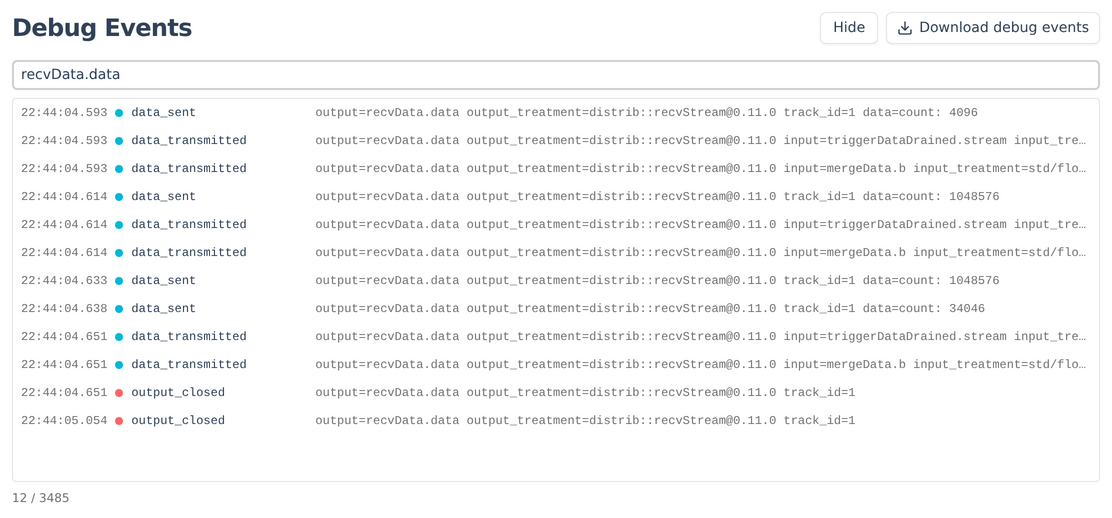
Filtered on recvData.data, the events above show the build’s binary reaching the smoke test in four chunks of 4096, 1048576, 1048576 and 34046 bytes, 2135294 bytes in all, the size the build step printed; then the output closes.
Events relayed from the machines that ran the steps appear as distant, with the run they come from and the event itself. The secret audit appears too, recording which element used which secret, by name only: see What Goes Through Cadence.CI.
Going Further
- Connect a Cloud, how the instance running a given step was chosen.
- How It Works, what’s captured today versus what’s on the roadmap.