Quickstart
Run the CI/CD template with its steps on machines Cadence.CI starts in your cloud account, and follow the run in the dashboard.
You need:
- Mélodium 0.11 or later (
melodium --version); - a Cadence.CI account: the free Access plan is enough;
- a cloud account with one of the supported providers.
1. Connect Your Cloud Account
In the dashboard, open Clouds, pick your provider, and click Connect. Connect a Cloud lists the fields to fill in and the permissions the credentials need.
2. Create the Pipeline
At the root of a Git repository:
melodium new --template cicd --path .melodium-ci cicdThis creates .melodium-ci/ with the CI/CD program: a build step and a test step, each in its own container on its own machine, the first one streaming a file to the second. CI/CD Template explains each part.
3. Check It
melodium check .melodium-ci/Compo.tomlNothing runs yet: Mélodium checks the whole program, types, connections and parameters, and prints nothing when it is valid. A mistake is reported here, with its line and its cause, in about a second instead of minutes later on a runner.
4. Create a Run Token
In the dashboard, open Tokens, then Create Token under Run Tokens. Copy the token when it appears: it is shown only once.
5. Run It
export MELODIUM_API_TOKEN="<your run token>"
melodium run --api-report .melodium-ci/Compo.toml \
  --repository_clone_url "https://github.com/<you>/<repository>.git" \
--repository_clone_ref main--api-reportreports the run to Cadence.CI, with its logs, debug events and program.- The template finds the run token in
MELODIUM_API_TOKENand asks Cadence.CI for a machine for each step. Cadence.CI starts them in your cloud account and stops them when the steps end. - The build step clones the repository itself, so use one it can reach, such as a public repository.
The logs also print in your terminal. The template’s steps ask for ARM64 machines: if the run shows Unschedulable, none of your connected accounts offers a matching instance type, see How Instance Selection Works.
No cloud account at hand yet? Add --work_location compose to run the steps as containers on your machine, with Docker or Podman and Compose installed.
6. Follow the Run
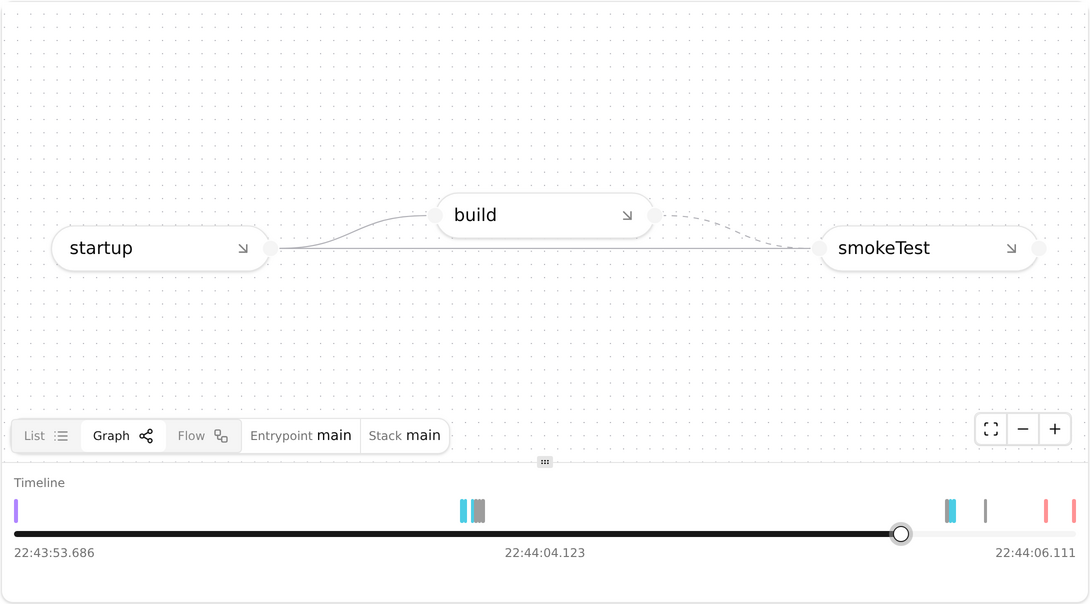
Open Runs in the dashboard. The run page shows the pipeline graph with the timeline of what the engine did, the logs, and the debug events. View Results walks through each part.
Next Steps
- How It Works: the life of a run, step by step.
- Concepts: programs, runs, runners and tokens, defined.
- What Goes Through Cadence.CI: what Cadence.CI receives, and how secrets stay on your side.
- Build a Pipeline with AI.
- Open-source plan: free for open-source projects, with public runs.
- Mélodium Language Book : the language behind the pipeline, from installation to distribution .
- Mélodium Reference : every treatment of the
cicdpackage and the others.